Global Acetonitrile Market Report: Trends, Growth and Forecast (2026-2032)
By Grade Type (Electronic Grade, Reagent Grade, Industrial Grade), By Type (Derivative, Solvent), By Application (Pharmaceuticals, Agrochemicals, Paints & Coatings, Electronics, Extraction Solvent), By Region (North America, Latin America, Europe, Middle East & Africa, Asia Pacific) ... Read more
|
Major Players
|
Global Acetonitrile Market Statistics and Insights, 2026
- Market Size Statistics
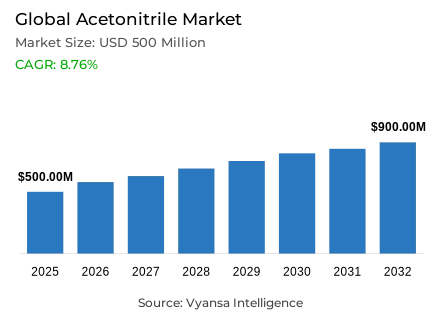
- Global acetonitrile market is estimated at USD 500 million in 2025.
- The market size is expected to grow to USD 900 million by 2032.
- Market to register a CAGR of around 8.76% during 2026-32.
- Grade Type Shares
- Reagent grade grabbed market share of 60%.
- Competition
- More than 25 companies are actively engaged in producing acetonitrile.
- Top 5 companies acquired around 40% of the market share.
- Nova Molecular Technologies; Tedia Company; Avantor Inc.; INEOS Nitriles (INEOS); Asahi Kasei Corporation etc., are few of the top companies.
- Application
- Pharmaceuticals grabbed 50% of the market.
- Region
- Asia Pacific leads with a 50% share of the global market.
Global Acetonitrile Market Outlook
Acetonitrile continues to be an essential solvent for pharmaceutical manufacturing and plays a vital role in active pharmaceutical ingredients (APIs), as well as analysis techniques like high-performance liquid chromatography (HPLC). As of 2025, the Global Acetonitrile Market is valued at 500 million USD and forecasted to hit 900 million USD by 2032, with a CAGR growth rate of 8.76% from 2026 to 2032. Continuous R&D expenditure in the pharmaceuticals sector, which attained 129 billion dollars as global expenditure in 2021, as per OECD statistics, remains a catalyst for acetonitrile consumption.
The developing nations, specifically India with more than 3,000 pharmaceutical businesses and 10,000 production facilities, make a substantial contribution. Production of acetonitrile is associated with acrylonitrile as a co-product, and procurement is limited due to propylene feedstock and strict environmental norms, including the REACH registration system followed in Europe. Moreover, some production facilities remain closed at times, and fluctuations in raw material prices and geopolitical issues have made it more challenging. To have an uninterrupted supply chain and achieve cost savings and sustainability goals, end-use customers have begun to increasingly focus on recovery and recycling. Advances in solvent recycling technologies meant that recycling occurs with negligible loss.
The Reagent Grade market leads with a 60% market share due to its medium-to-high purity levels, making it apt for drug synthesis, research, and lab use. Its suitability and cost-effectiveness make it more sought after among end-use customers who need drug compliance without spending on more expensive grades. Consequently, drug uses contribute 50% to overall market consumption driven by active ingredients, antibiotic synthesis, and vitamin production. Rising complexities and strict standards for drug synthesis and production sustain market demand within that sector.
Additionally, Asia-Pacific dominates the market with a 50% share, mainly due to large pharmaceutical production capacity and an emerging production base in India. Downstream end-users can tap into more production infrastructure, making it feasible to consume solvents. Overall investment in production facilities and infrastructure enhances the region’s competitive edge. As a result, region-wise dominance and growth within the pharmaceutical market will enable consistent market growth and predictability for acetonitrile consumption till 2032.

Global Acetonitrile Market Growth Driver
Growing Pharmaceutical Dependence as a Primary Consumption Driver
Acetonitrile remains an integral part of active pharmaceutical ingredients synthesis as a vital solvent. Investments made within the global pharmaceutical R&D reached a value of 129 billion USD as of 2021, as indicated by the OECD. The business sector expenditure on pharmaceutical R&D accumulated a 39% increase within 2010 and 2021. A considerable amount of expenditure influences the demand for highly pure acetonitrile. Active end-users have depended on acetonitrile within research and production bodies as a vital part to attain efficiency and adhere to strict standards.
The critical role acetonitrile plays as a solvent within analytical testing and HPLC procedures continuously creates demand. Pharmaceutical production within the emerging economies of India will remain on an uptrend with an expected compound annual growth rate within five years at 2.2-2.4 times, based on government numbers. A tighter regulatory requirement around the objective for global end-quality will sustain consumption levels of high-purity acetonitrile throughout 2032.
Global Acetonitrile Market Challenge
Supply Vulnerabilities and Raw Material Limitations
Acetonitrile production also shows an inherent tie with acrylonitrile production, as it is produced as a co-product. Due to regulatory pressures, mainly because of the need for health, safety, and environmental regulations as per the framework within the European Union’s REACH regulations, there are limitations on production capacity within a developed area. These changes in environmental regulations have constantly added pressure on environmental compliance, mainly after 2007, thus making it more volatile due to supply shrinkage.
Moreover, uncertainties emerging from intermittent shutdowns within plants, lower acrylonitrile demand, and raw material price variability impact margins and planning associated with acetonitrile production. Geopolitics and environmental compliance requirements introduce additional complicating factors within supply chain dynamics, causing end-product end-users to be exposed to intricate procurement challenges. All these challenges will continue to be relevant within the period spanning 2026-2032.
Unlock Market Intelligence
Explore the market potential with our data-driven report
Global Acetonitrile Market Trend
Advancements in Solvent Recovery and Sustainability Initiatives
Strict environmental regulations and an increase in waste disposal costs are pushing chemical and pharmaceutical producers towards using efficient acetonitrile recovery and recycling technologies. The use of recycled solvents within the European Union's framework under REACH regulations enables recycled solvents to return to the market. End-use customers are becoming aware of acetonitrile as an inexpensive and ecologically friendly substitute for virgin solvent.
Advances in technologies for recovering solvents make recycling possible with hardly any loss of quality and thus with reduced costs and environmental impacts. Installation of facilities and adaptive technologies at various sites in Europe is imminent as it will eventually address compliance standards and at the same time optimize facility operations. Adoption of technologies for recovering solvents will remain an integral trend within 2026-2032, with developments based on the strict norms set within the EU.
Global Acetonitrile Market Opportunity
Expansion of Pharmaceutical Manufacturing in Emerging Economies
The ballooning presence of pharmacological and drug-manufacturing facilities within emerging nations is leading to an ever-increasing market for acetonitrile as a solvent within active pharmaceutical ingredient synthesis labs and testing facilities. India alone, for example, boasts 3,000 pharmaceutical businesses, 10,000 manufacturing units, and 650 US-FDA approved facilities—the greatest number outside the USA.
India’s position as the global leader in the supply of generic versions, as it accounts for one out of every five global generic drug sales, further reinforces this. Trade agreements and procurement arrangements entered into among local firms and suppliers of acetonitrile help form an uninterrupted procurement chain. The region’s shift in the production of Pharmaceuticals aids suppliers in capitalizing on market growth as they subscribe to unified standards set following global regulations.
Global Acetonitrile Market Regional Analysis

By Region
- North America
- Latin America
- Europe
- Middle East & Africa
- Asia Pacific
Asia-Pacific leads the global market with a 50% share, driven by substantial pharmaceutical manufacturing capacity and emerging markets’ contribution to global growth. India, with 10,000 manufacturing facilities, 3,000 pharmaceutical companies, and 650 US-FDA-compliant plants—the highest outside the U.S.—forms the structural center of acetonitrile demand. End users in the region benefit from this concentration of production capabilities, supporting consistent solvent consumption.
Regional dominance extends beyond pharmaceuticals to include agrochemical production, electronics applications, and analytical laboratory services. Continuous infrastructure investment and optimized supply chains further strengthen the competitive position of Asia-Pacific. Projected growth in India’s pharmaceutical sector, estimated at 2.2 to 2.4 times over the next five years, ensures sustained leadership through 2032, driven by both established manufacturing hubs and emerging production centers across the region.
Unlock Market Intelligence
Explore the market potential with our data-driven report
Global Acetonitrile Market Segmentation Analysis
By Grade Type
- Electronic Grade
- Reagent Grade
- Industrial Grade
The Reagent Grade segment holds the largest market share, approximately 60%, reflecting its critical application across pharmaceutical synthesis, chemical research, and laboratory operations. End users favor this grade for medium-to-high purity requirements, balancing quality and cost-effectiveness. Its versatility in routine synthesis, extraction, and chromatographic applications ensures its widespread adoption across various chemical and pharmaceutical processes.
The sustained preference for Reagent Grade is supported by the need to maintain regulatory compliance while optimizing operational costs. End users consistently select this grade to achieve reliable performance without the expense of premium-grade alternatives. As pharmaceutical manufacturing expands globally and laboratory operations increase, Reagent Grade acetonitrile is expected to retain its leading position through 2032, reflecting stable and predictable market demand.

By Application
- Pharmaceuticals
- Agrochemicals
- Paints & Coatings
- Electronics
- Extraction Solvent
Pharmaceutical applications command the highest share in the application category, approximately 50%, highlighting acetonitrile’s indispensable role in API synthesis, antibiotics production, and vitamin formulation. End users rely on acetonitrile for solvent, reagent, and synthetic intermediate functions, supporting both drug development and commercial manufacturing operations.
Sustained growth in the pharmaceutical sector ensures continuous expansion of acetonitrile demand across formulation development, analytical testing, and quality assurance processes. Increasingly complex drug synthesis protocols, tighter regulatory requirements, and geographic diversification of pharmaceutical production maintain the segment’s dominance. Pharmaceuticals remain the most stable and predictable application segment in the global market, underpinning long-term consumption trends through 2032.
Market Players in Global Acetonitrile Market
These market players maintain a significant presence in the Global acetonitrile market sector and contribute to its ongoing evolution.
- Nova Molecular Technologies
- Tedia Company
- Avantor Inc.
- INEOS Nitriles (INEOS)
- Asahi Kasei Corporation
- Formosa Plastics Corporation
- Honeywell International
- Merck KGaA (and distribution arms)
- Imperial Chemical Corporation
- Jindal Speciality Chemicals
- Henan GP Chemicals
- Shandong Xinhua Pharma / Chinese producers
- Zhengzhou Meiya Chemical
- Cepsa
- Alkyl Amines Chemicals Limited
Market News & Updates
- INEOS Nitriles, 2025:
Launched INVIREO™, the world's first bio-based acetonitrile using certified (ISCC+) mass balance route, delivering 90% reduction in carbon footprint for pharmaceutical manufacturing including insulin and vaccine production.
- Asahi Kasei Corporation, 2025:
Announced strategic discontinuation of acetonitrile production at Kawasaki refinery by March 2026, shifting supply to subsidiary Tongsuh Petrochemical Corp. in South Korea with plant capacity of 14,000 metric tons per year.
Frequently Asked Questions
Related Report
1. Market Segmentation
1.1. Research Scope
1.2. Research Methodology
1.3. Definitions and Assumptions
2. Executive Summary
3. Global Acetonitrile Market Policies, Regulations, and Standards
4. Global Acetonitrile Market Dynamics
4.1. Growth Factors
4.2. Challenges
4.3. Trends
4.4. Opportunities
5. Global Acetonitrile Market Statistics, 2022-2032F
5.1. Market Size & Growth Outlook
5.1.1.By Revenues in USD Million
5.2. Market Segmentation & Growth Outlook
5.2.1.By Grade Type
5.2.1.1. Electronic Grade- Market Insights and Forecast 2022-2032, USD Million
5.2.1.2. Reagent Grade- Market Insights and Forecast 2022-2032, USD Million
5.2.1.3. Industrial Grade- Market Insights and Forecast 2022-2032, USD Million
5.2.2.By Type
5.2.2.1. Derivative- Market Insights and Forecast 2022-2032, USD Million
5.2.2.2. Solvent- Market Insights and Forecast 2022-2032, USD Million
5.2.3.By Application
5.2.3.1. Pharmaceuticals- Market Insights and Forecast 2022-2032, USD Million
5.2.3.2. Agrochemicals- Market Insights and Forecast 2022-2032, USD Million
5.2.3.3. Paints & Coatings- Market Insights and Forecast 2022-2032, USD Million
5.2.3.4. Electronics- Market Insights and Forecast 2022-2032, USD Million
5.2.3.5. Extraction Solvent- Market Insights and Forecast 2022-2032, USD Million
5.2.4.By Region
5.2.4.1. North America
5.2.4.2. Latin America
5.2.4.3. Europe
5.2.4.4. Middle East & Africa
5.2.4.5. Asia Pacific
5.2.5.By Competitors
5.2.5.1. Competition Characteristics
5.2.5.2. Market Share & Analysis
6. North America Acetonitrile Market Statistics, 2022-2032F
6.1. Market Size & Growth Outlook
6.1.1.By Revenues in USD Million
6.2. Market Segmentation & Growth Outlook
6.2.1.By Grade Type- Market Insights and Forecast 2022-2032, USD Million
6.2.2.By Type- Market Insights and Forecast 2022-2032, USD Million
6.2.3.By Application- Market Insights and Forecast 2022-2032, USD Million
6.2.4.By Country
6.2.4.1. US
6.2.4.2. Canada
6.2.4.3. Mexico
6.2.4.4. Rest of North America
6.3. US Acetonitrile Market Statistics, 2022-2032F
6.3.1.Market Size & Growth Outlook
6.3.1.1. By Revenues in USD Million
6.3.2.Market Segmentation & Growth Outlook
6.3.2.1. By Grade Type- Market Insights and Forecast 2022-2032, USD Million
6.3.2.2. By Application- Market Insights and Forecast 2022-2032, USD Million
6.4. Canada Acetonitrile Market Statistics, 2022-2032F
6.4.1.Market Size & Growth Outlook
6.4.1.1. By Revenues in USD Million
6.4.2.Market Segmentation & Growth Outlook
6.4.2.1. By Grade Type- Market Insights and Forecast 2022-2032, USD Million
6.4.2.2. By Application- Market Insights and Forecast 2022-2032, USD Million
6.5. Mexico Acetonitrile Market Statistics, 2022-2032F
6.5.1.Market Size & Growth Outlook
6.5.1.1. By Revenues in USD Million
6.5.2.Market Segmentation & Growth Outlook
6.5.2.1. By Grade Type- Market Insights and Forecast 2022-2032, USD Million
6.5.2.2. By Application- Market Insights and Forecast 2022-2032, USD Million
7. Latin America Acetonitrile Market Statistics, 2022-2032F
7.1. Market Size & Growth Outlook
7.1.1.By Revenues in USD Million
7.2. Market Segmentation & Growth Outlook
7.2.1.By Grade Type- Market Insights and Forecast 2022-2032, USD Million
7.2.2.By Type- Market Insights and Forecast 2022-2032, USD Million
7.2.3.By Application- Market Insights and Forecast 2022-2032, USD Million
7.2.4.By Country
7.2.4.1. Brazil
7.2.4.2. Rest of Latin America
7.3. Brazil Acetonitrile Market Statistics, 2022-2032F
7.3.1.Market Size & Growth Outlook
7.3.1.1. By Revenues in USD Million
7.3.2.Market Segmentation & Growth Outlook
7.3.2.1. By Grade Type- Market Insights and Forecast 2022-2032, USD Million
7.3.2.2. By Application- Market Insights and Forecast 2022-2032, USD Million
8. Europe Acetonitrile Market Statistics, 2022-2032F
8.1. Market Size & Growth Outlook
8.1.1.By Revenues in USD Million
8.2. Market Segmentation & Growth Outlook
8.2.1.By Grade Type- Market Insights and Forecast 2022-2032, USD Million
8.2.2.By Type- Market Insights and Forecast 2022-2032, USD Million
8.2.3.By Application- Market Insights and Forecast 2022-2032, USD Million
8.2.4.By Country
8.2.4.1. Germany
8.2.4.2. France
8.2.4.3. UK
8.2.4.4. Italy
8.2.4.5. Spain
8.2.4.6. Netherlands
8.2.4.7. Belgium
8.2.4.8. Poland
8.2.4.9. Russia
8.2.4.10. Turkey
8.2.4.11. Rest of Europe
8.3. Germany Acetonitrile Market Statistics, 2022-2032F
8.3.1.Market Size & Growth Outlook
8.3.1.1. By Revenues in USD Million
8.3.2.Market Segmentation & Growth Outlook
8.3.2.1. By Grade Type- Market Insights and Forecast 2022-2032, USD Million
8.3.2.2. By Application- Market Insights and Forecast 2022-2032, USD Million
8.4. France Acetonitrile Market Statistics, 2022-2032F
8.4.1.Market Size & Growth Outlook
8.4.1.1. By Revenues in USD Million
8.4.2.Market Segmentation & Growth Outlook
8.4.2.1. By Grade Type- Market Insights and Forecast 2022-2032, USD Million
8.4.2.2. By Application- Market Insights and Forecast 2022-2032, USD Million
8.5. UK Acetonitrile Market Statistics, 2022-2032F
8.5.1.Market Size & Growth Outlook
8.5.1.1. By Revenues in USD Million
8.5.2.Market Segmentation & Growth Outlook
8.5.2.1. By Grade Type- Market Insights and Forecast 2022-2032, USD Million
8.5.2.2. By Application- Market Insights and Forecast 2022-2032, USD Million
8.6. Italy Acetonitrile Market Statistics, 2022-2032F
8.6.1.Market Size & Growth Outlook
8.6.1.1. By Revenues in USD Million
8.6.2.Market Segmentation & Growth Outlook
8.6.2.1. By Grade Type- Market Insights and Forecast 2022-2032, USD Million
8.6.2.2. By Application- Market Insights and Forecast 2022-2032, USD Million
8.7. Spain Acetonitrile Market Statistics, 2022-2032F
8.7.1.Market Size & Growth Outlook
8.7.1.1. By Revenues in USD Million
8.7.2.Market Segmentation & Growth Outlook
8.7.2.1. By Grade Type- Market Insights and Forecast 2022-2032, USD Million
8.7.2.2. By Application- Market Insights and Forecast 2022-2032, USD Million
8.8. Netherlands Acetonitrile Market Statistics, 2022-2032F
8.8.1.Market Size & Growth Outlook
8.8.1.1. By Revenues in USD Million
8.8.2.Market Segmentation & Growth Outlook
8.8.2.1. By Grade Type- Market Insights and Forecast 2022-2032, USD Million
8.8.2.2. By Application- Market Insights and Forecast 2022-2032, USD Million
8.9. Belgium Acetonitrile Market Statistics, 2022-2032F
8.9.1.Market Size & Growth Outlook
8.9.1.1. By Revenues in USD Million
8.9.2.Market Segmentation & Growth Outlook
8.9.2.1. By Grade Type- Market Insights and Forecast 2022-2032, USD Million
8.9.2.2. By Application- Market Insights and Forecast 2022-2032, USD Million
8.10. Poland Acetonitrile Market Statistics, 2022-2032F
8.10.1. Market Size & Growth Outlook
8.10.1.1. By Revenues in USD Million
8.10.2. Market Segmentation & Growth Outlook
8.10.2.1. By Grade Type- Market Insights and Forecast 2022-2032, USD Million
8.10.2.2. By Application- Market Insights and Forecast 2022-2032, USD Million
8.11. Russia Acetonitrile Market Statistics, 2022-2032F
8.11.1. Market Size & Growth Outlook
8.11.1.1. By Revenues in USD Million
8.11.2. Market Segmentation & Growth Outlook
8.11.2.1. By Grade Type- Market Insights and Forecast 2022-2032, USD Million
8.11.2.2. By Application- Market Insights and Forecast 2022-2032, USD Million
8.12. Turkey Acetonitrile Market Statistics, 2022-2032F
8.12.1. Market Size & Growth Outlook
8.12.1.1. By Revenues in USD Million
8.12.2. Market Segmentation & Growth Outlook
8.12.2.1. By Grade Type- Market Insights and Forecast 2022-2032, USD Million
8.12.2.2. By Application- Market Insights and Forecast 2022-2032, USD Million
9. Middle East & Africa Acetonitrile Market Statistics, 2022-2032F
9.1. Market Size & Growth Outlook
9.1.1.By Revenues in USD Million
9.2. Market Segmentation & Growth Outlook
9.2.1.By Grade Type- Market Insights and Forecast 2022-2032, USD Million
9.2.2.By Type- Market Insights and Forecast 2022-2032, USD Million
9.2.3.By Application- Market Insights and Forecast 2022-2032, USD Million
9.2.4.By Country
9.2.4.1. Saudi Arabia
9.2.4.2. UAE
9.2.4.3. Rest of Middle East & Africa
9.3. Saudi Arabia Acetonitrile Market Statistics, 2022-2032F
9.3.1.Market Size & Growth Outlook
9.3.1.1. By Revenues in USD Million
9.3.2.Market Segmentation & Growth Outlook
9.3.2.1. By Grade Type- Market Insights and Forecast 2022-2032, USD Million
9.3.2.2. By Application- Market Insights and Forecast 2022-2032, USD Million
9.4. UAE Acetonitrile Market Statistics, 2022-2032F
9.4.1.Market Size & Growth Outlook
9.4.1.1. By Revenues in USD Million
9.4.2.Market Segmentation & Growth Outlook
9.4.2.1. By Grade Type- Market Insights and Forecast 2022-2032, USD Million
9.4.2.2. By Application- Market Insights and Forecast 2022-2032, USD Million
10. Asia Pacific Acetonitrile Market Statistics, 2022-2032F
10.1. Market Size & Growth Outlook
10.1.1. By Revenues in USD Million
10.2. Market Segmentation & Growth Outlook
10.2.1. By Grade Type- Market Insights and Forecast 2022-2032, USD Million
10.2.2. By Type- Market Insights and Forecast 2022-2032, USD Million
10.2.3. By Application- Market Insights and Forecast 2022-2032, USD Million
10.2.4. By Country
10.2.4.1. China
10.2.4.2. Japan
10.2.4.3. South Korea
10.2.4.4. India
10.2.4.5. Australia
10.2.4.6. Thailand
10.2.4.7. Rest of Asia Pacific
10.3. China Acetonitrile Market Statistics, 2022-2032F
10.3.1. Market Size & Growth Outlook
10.3.1.1. By Revenues in USD Million
10.3.2. Market Segmentation & Growth Outlook
10.3.2.1. By Grade Type- Market Insights and Forecast 2022-2032, USD Million
10.3.2.2. By Application- Market Insights and Forecast 2022-2032, USD Million
10.4. Japan Acetonitrile Market Statistics, 2022-2032F
10.4.1. Market Size & Growth Outlook
10.4.1.1. By Revenues in USD Million
10.4.2. Market Segmentation & Growth Outlook
10.4.2.1. By Grade Type- Market Insights and Forecast 2022-2032, USD Million
10.4.2.2. By Application- Market Insights and Forecast 2022-2032, USD Million
10.5. South Korea Acetonitrile Market Statistics, 2022-2032F
10.5.1. Market Size & Growth Outlook
10.5.1.1. By Revenues in USD Million
10.5.2. Market Segmentation & Growth Outlook
10.5.2.1. By Grade Type- Market Insights and Forecast 2022-2032, USD Million
10.5.2.2. By Application- Market Insights and Forecast 2022-2032, USD Million
10.6. India Acetonitrile Market Statistics, 2022-2032F
10.6.1. Market Size & Growth Outlook
10.6.1.1. By Revenues in USD Million
10.6.2. Market Segmentation & Growth Outlook
10.6.2.1. By Grade Type- Market Insights and Forecast 2022-2032, USD Million
10.6.2.2. By Application- Market Insights and Forecast 2022-2032, USD Million
10.7. Australia Acetonitrile Market Statistics, 2022-2032F
10.7.1. Market Size & Growth Outlook
10.7.1.1. By Revenues in USD Million
10.7.2. Market Segmentation & Growth Outlook
10.7.2.1. By Grade Type- Market Insights and Forecast 2022-2032, USD Million
10.7.2.2. By Application- Market Insights and Forecast 2022-2032, USD Million
10.8. Thailand Acetonitrile Market Statistics, 2022-2032F
10.8.1. Market Size & Growth Outlook
10.8.1.1. By Revenues in USD Million
10.8.2. Market Segmentation & Growth Outlook
10.8.2.1. By Grade Type- Market Insights and Forecast 2022-2032, USD Million
10.8.2.2. By Application- Market Insights and Forecast 2022-2032, USD Million
11. Competitive Outlook
11.1. Company Profiles
11.1.1. INEOS Nitriles (INEOS)
11.1.1.1. Business Description
11.1.1.2. Product Portfolio
11.1.1.3. Collaborations & Alliances
11.1.1.4. Recent Developments
11.1.1.5. Financial Details
11.1.1.6. Others
11.1.2. Asahi Kasei Corporation
11.1.2.1. Business Description
11.1.2.2. Product Portfolio
11.1.2.3. Collaborations & Alliances
11.1.2.4. Recent Developments
11.1.2.5. Financial Details
11.1.2.6. Others
11.1.3. Formosa Plastics Corporation
11.1.3.1. Business Description
11.1.3.2. Product Portfolio
11.1.3.3. Collaborations & Alliances
11.1.3.4. Recent Developments
11.1.3.5. Financial Details
11.1.3.6. Others
11.1.4. Honeywell International
11.1.4.1. Business Description
11.1.4.2. Product Portfolio
11.1.4.3. Collaborations & Alliances
11.1.4.4. Recent Developments
11.1.4.5. Financial Details
11.1.4.6. Others
11.1.5. Merck KGaA (and distribution arms)
11.1.5.1. Business Description
11.1.5.2. Product Portfolio
11.1.5.3. Collaborations & Alliances
11.1.5.4. Recent Developments
11.1.5.5. Financial Details
11.1.5.6. Others
11.1.6. Nova Molecular Technologies
11.1.6.1. Business Description
11.1.6.2. Product Portfolio
11.1.6.3. Collaborations & Alliances
11.1.6.4. Recent Developments
11.1.6.5. Financial Details
11.1.6.6. Others
11.1.7. Tedia Company
11.1.7.1. Business Description
11.1.7.2. Product Portfolio
11.1.7.3. Collaborations & Alliances
11.1.7.4. Recent Developments
11.1.7.5. Financial Details
11.1.7.6. Others
11.1.8. Avantor Inc.
11.1.8.1. Business Description
11.1.8.2. Product Portfolio
11.1.8.3. Collaborations & Alliances
11.1.8.4. Recent Developments
11.1.8.5. Financial Details
11.1.8.6. Others
11.1.9. Imperial Chemical Corporation
11.1.9.1. Business Description
11.1.9.2. Product Portfolio
11.1.9.3. Collaborations & Alliances
11.1.9.4. Recent Developments
11.1.9.5. Financial Details
11.1.9.6. Others
11.1.10. Jindal Speciality Chemicals
11.1.10.1.Business Description
11.1.10.2.Product Portfolio
11.1.10.3.Collaborations & Alliances
11.1.10.4.Recent Developments
11.1.10.5.Financial Details
11.1.10.6.Others
11.1.11. Henan GP Chemicals
11.1.11.1.Business Description
11.1.11.2.Product Portfolio
11.1.11.3.Collaborations & Alliances
11.1.11.4.Recent Developments
11.1.11.5.Financial Details
11.1.11.6.Others
11.1.12. Shandong Xinhua Pharma / Chinese producers
11.1.12.1.Business Description
11.1.12.2.Product Portfolio
11.1.12.3.Collaborations & Alliances
11.1.12.4.Recent Developments
11.1.12.5.Financial Details
11.1.12.6.Others
11.1.13. Zhengzhou Meiya Chemical
11.1.13.1.Business Description
11.1.13.2.Product Portfolio
11.1.13.3.Collaborations & Alliances
11.1.13.4.Recent Developments
11.1.13.5.Financial Details
11.1.13.6.Others
11.1.14. Cepsa
11.1.14.1.Business Description
11.1.14.2.Product Portfolio
11.1.14.3.Collaborations & Alliances
11.1.14.4.Recent Developments
11.1.14.5.Financial Details
11.1.14.6.Others
11.1.15. Alkyl Amines Chemicals Limited
11.1.15.1.Business Description
11.1.15.2.Product Portfolio
11.1.15.3.Collaborations & Alliances
11.1.15.4.Recent Developments
11.1.15.5.Financial Details
11.1.15.6.Others
12. Disclaimer
| Segment | Sub-Segment |
|---|---|
| By Grade Type |
|
| By Type |
|
| By Application |
|
| By Region |
|
Research Methodology
This study followed a structured approach comprising four key phases to assess the size and scope of the electro-oxidation market. The process began with thorough secondary research to collect data on the target market, related markets, and broader industry context. These findings, along with preliminary assumptions and estimates, were then validated through extensive primary research involving industry experts from across the value chain. To calculate the overall market size, both top-down and bottom-up methodologies were employed. Finally, market segmentation and data triangulation techniques were applied to refine and validate segment-level estimations.
Secondary Research
The secondary research phase involved gathering data from a wide range of credible and published sources. This step helped in identifying industry trends, defining market segmentation, and understanding the market landscape and value chain.
Sources consulted during this phase included:
- Company annual reports, investor presentations, and press releases
- Industry white papers and certified publications
- Trade directories and market-recognized databases
- Articles from authoritative authors and reputable journals
- Gold and silver standard websites
Secondary research was critical in mapping out the industry's value chain and monetary flow, identifying key market segments, understanding regional variations, and tracking significant industry developments.
Other key sources:
- Financial disclosures
- Industry associations and trade bodies
- News outlets and business magazines
- Academic journals and research studies
- Paid industry databases
Primary Research
To validate secondary data and gain deeper market insights, primary research was conducted with key stakeholders across both the supply and demand sides of the market.
On the demand side, participants included decision-makers and influencers from end-user industries—such as CIOs, CTOs, and CSOs—who provided first-hand perspectives on market needs, product usage, and future expectations.
On the supply side, interviews were conducted with manufacturers, industry associations, and institutional participants to gather insights into current offerings, product pipelines, and market challenges.
Primary interviews provided critical inputs such as:
- Market size and revenue data
- Product and service breakdowns
- Market forecasts
- Regional and application-specific trends
Stakeholders consulted included:
- Leading OEM and solution providers
- Channel and distribution partners
- End users across various applications
- Independent consultants and industry specialists
Market Size Estimation and Data Triangulation
- Identifying Key Market Participants (Secondary Research)
- Goal: To identify the major players or companies in the target market. This typically involves using publicly available data sources such as industry reports, market research publications, and financial statements of companies.
- Tools: Reports from firms like Gartner, Forrester, Euromonitor, Statista, IBISWorld, and others. Public financial statements, news articles, and press releases from top market players.
- Extracting Earnings of Key Market Participants
- Goal: To estimate the earnings generated from the product or service being analyzed. This step helps in understanding the revenue potential of each market player in a specific geography.
- Methods: Earnings data can be gathered from:
- Publicly available financial reports (for listed companies).
- Interviews and primary data sources from professionals, such as Directors, VPs, SVPs, etc. This is especially useful for understanding more nuanced, internal data that isn't publicly disclosed.
- Annual reports and investor presentations of key players.
- Data Collation and Development of a Relevant Data Model
- Goal: To collate inputs from both primary and secondary sources into a structured, data-driven model for market estimation. This model will incorporate key market KPIs and any independent variables relevant to the market.
- Key KPIs: These could include:
- Market size, growth rate, and demand drivers.
- Industry-specific metrics like market share, average revenue per customer (ARPC), or average deal size.
- External variables, such as economic growth rates, inflation rates, or commodity prices, that could affect the market.
- Data Modeling: Based on this data, the market forecasts are developed for the next 5 years. A combination of trend analysis, scenario modeling, and statistical regression might be used to generate projections.
- Scenario Analysis
- Goal: To test different assumptions and validate how sensitive the market is to changes in key variables (e.g., market demand, regulatory changes, technological disruptions).
- Types of Scenarios:
- Base Case: Based on current assumptions and historical data.
- Best-Case Scenario: Assuming favorable market conditions, regulatory environments, and technological advancements.
- Worst-Case Scenario: Accounting for adverse factors, such as economic downturns, stricter regulations, or unexpected disruptions.


